The following function estimates a dinosaur’s mass based on its length and name of its taxonomic group:
get_mass_from_length_by_name <-function(length, name){if (name =="Stegosauria"){ mass =10.95* length ^2.64 }elseif (name =="Theropoda"){ mass =0.73* length ^3.63 }elseif (name =="Sauropoda"){ mass =214.44* length ^1.46 }else { mass =NA }return(mass)}
Update this function so that instead of returning NA when none of the species names matches it returns mass = 25.37 * length ^ 2.49 instead.
Use this function and a for loop to calculate the estimated mass for each dinosaur in dinosaur_lengths, store the masses in a vector, and after all of the calculations are complete show the first few items in the vector using head().
Add the results in the vector back to the original data frame and display the new data frame.
Calculate the mean mass for each species using dplyr, using the data from you created in (2).
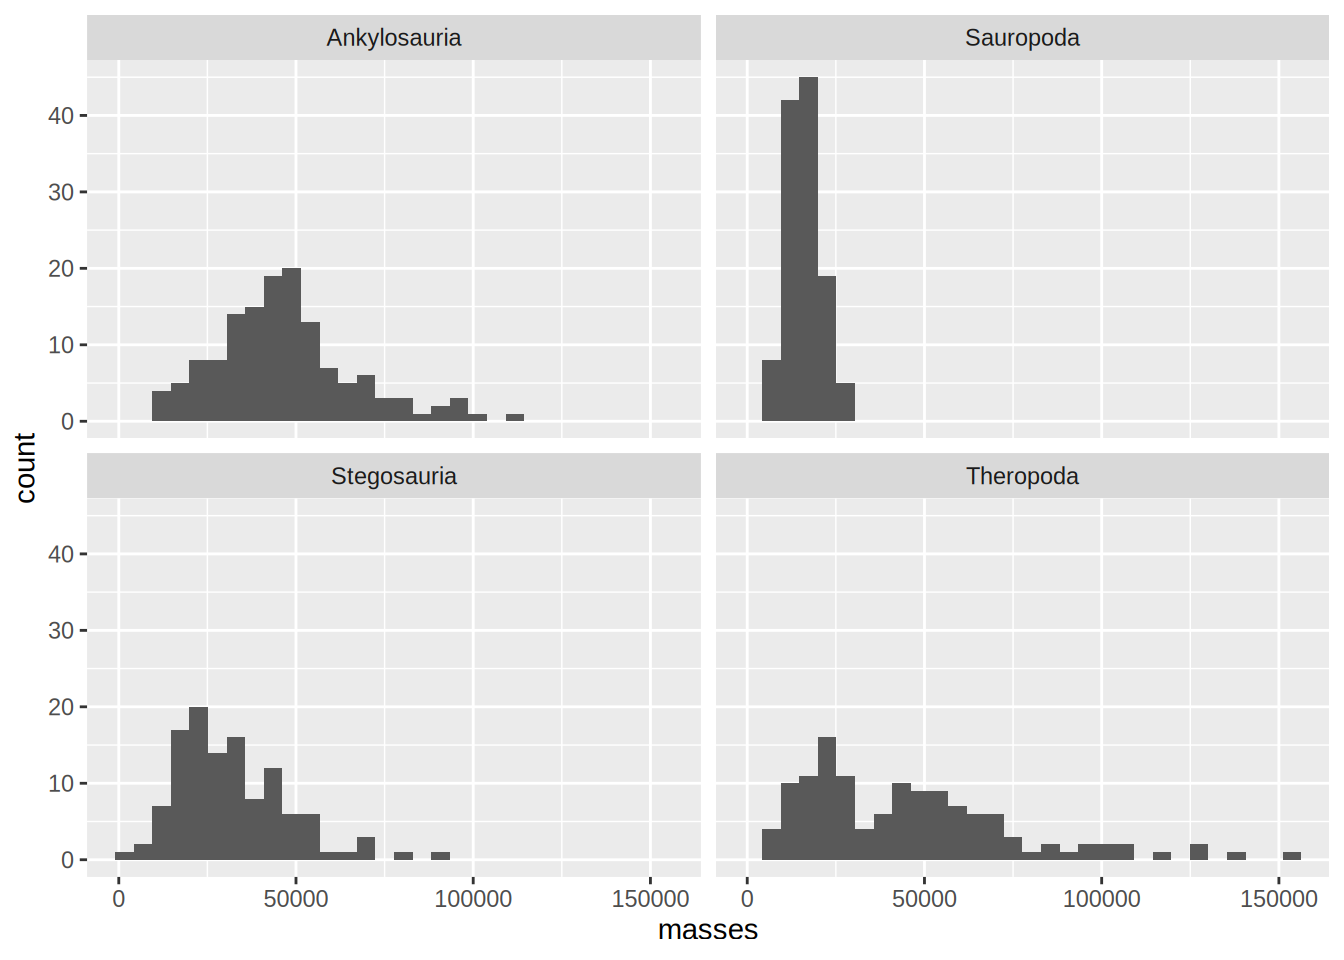
Use ggplot2 to make a histogram of the masses from (2) with a separate subplot for each species (using facet_wrap()).
CautionOutput solution
Attaching package: 'dplyr'
The following objects are masked from 'package:stats':

    filter, lag
The following objects are masked from 'package:base':

    intersect, setdiff, setequal, union
Rows: 500 Columns: 2
── Column specification ────────────────────────────────────────────────────────
Delimiter: ","
chr (1): species
dbl (1): lengths

ℹ Use `spec()` to retrieve the full column specification for this data.
ℹ Specify the column types or set `show_col_types = FALSE` to quiet this message.