acacia <-read_tsv("ACACIA_DREPANOLOBIUM_SURVEY.txt", na =c("dead"))
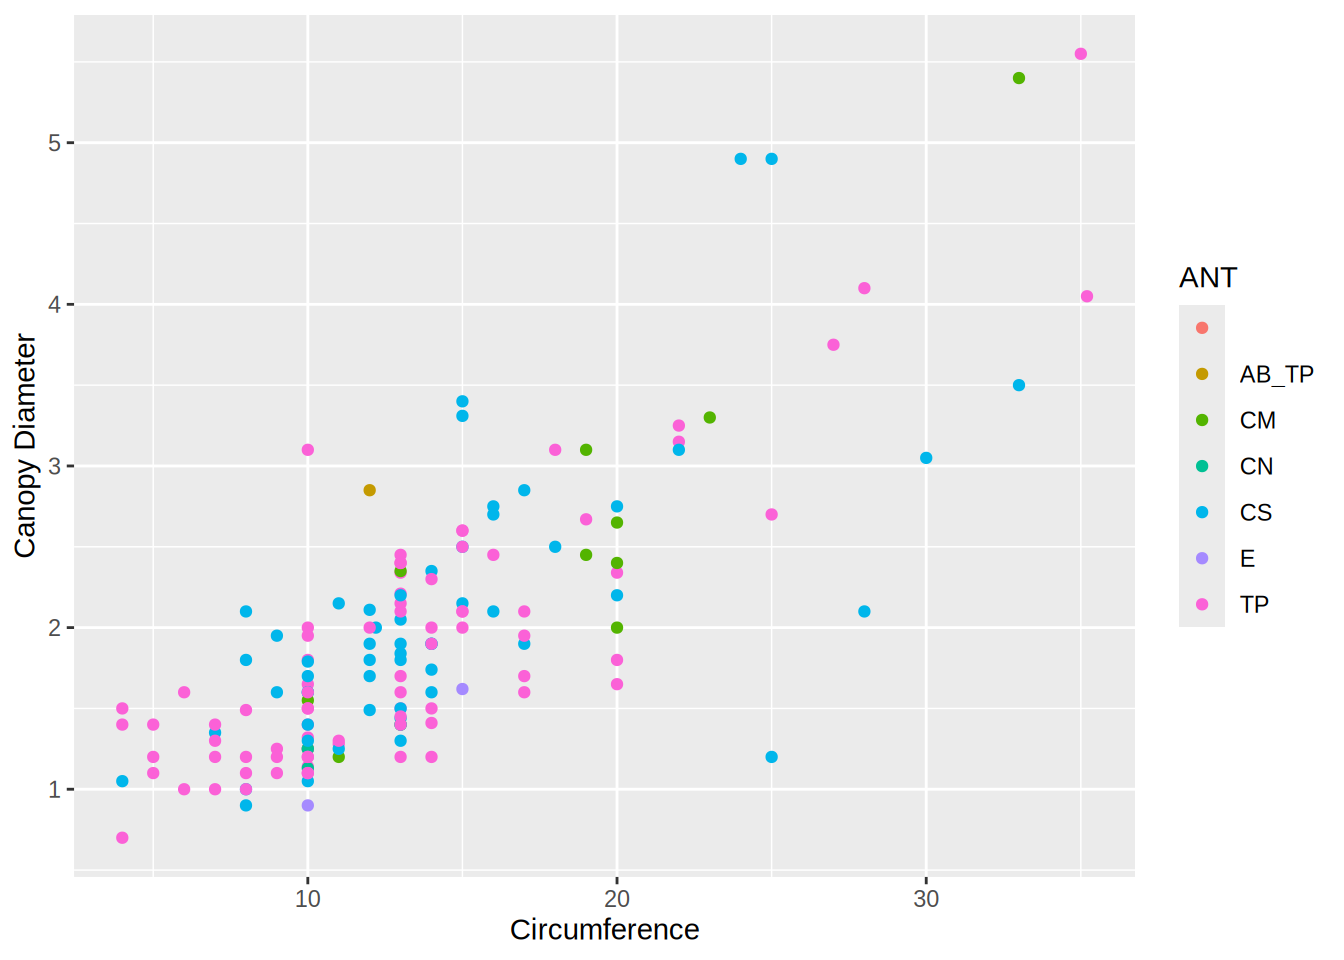
Make a scatter plot with CIRC on the x axis and AXIS1 (the maximum canopy width) on the y axis, with points colored based on the ANT column (the species of ant symbiont living with the acacia). Label the x axis “Circumference” and the y axis “Canopy Diameter”.
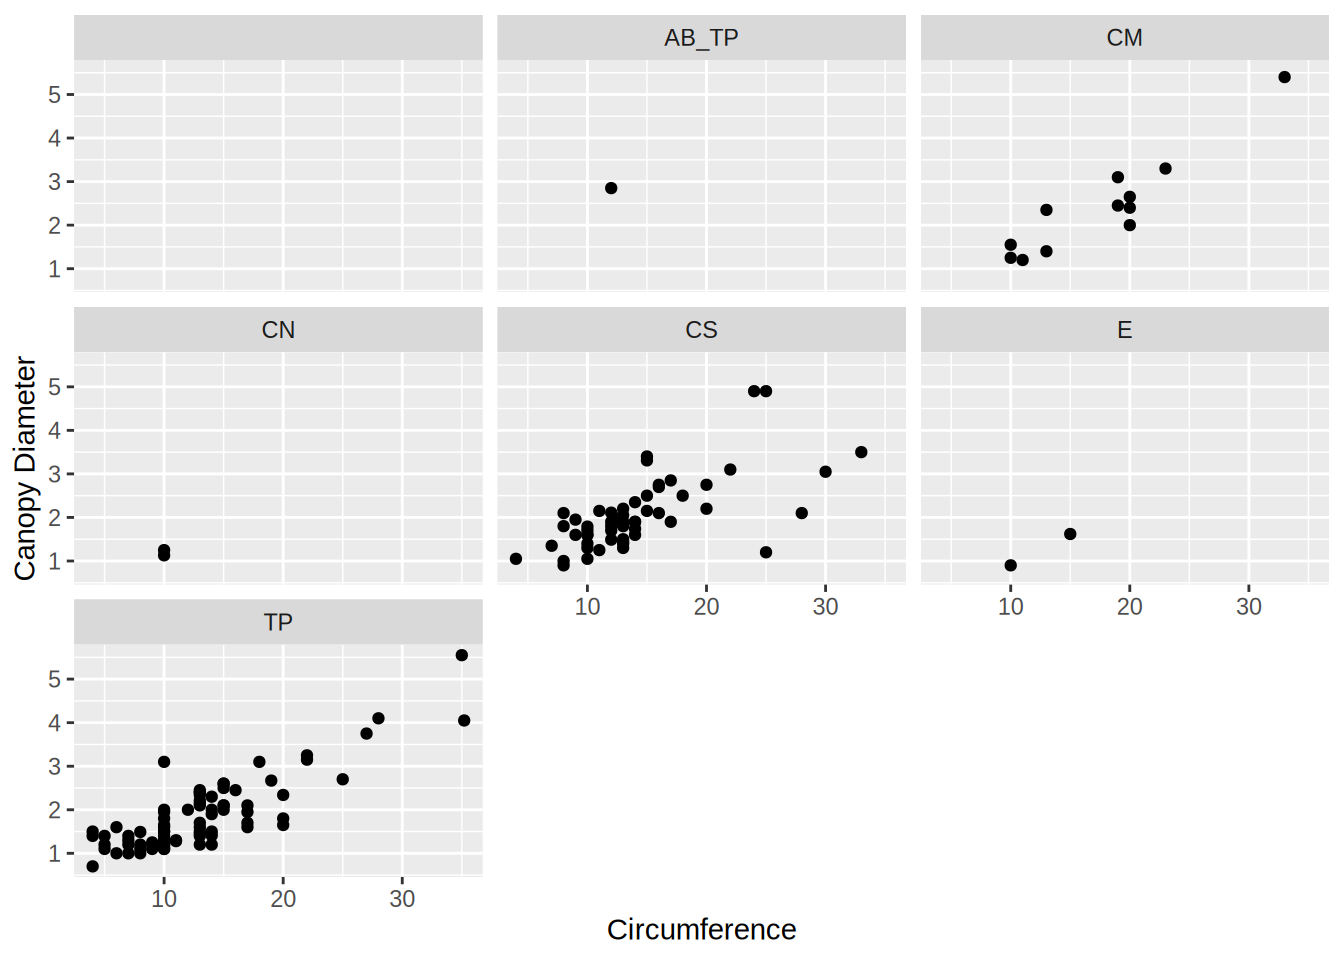
The same plot as (1), but instead of different colors show different species of ant (values of ANT) each in a separate subplot.
CautionOutput solution
Code solution for Graphing Acacia and Ants Color and Facets
Warning: One or more parsing issues, call `problems()` on your data frame for details,
e.g.:
  dat <- vroom(...)
  problems(dat)
Rows: 157 Columns: 15
── Column specification ────────────────────────────────────────────────────────
Delimiter: "\t"
chr  (4): SITE, TREATMENT, PLOT, ANT
dbl (11): SURVEY, YEAR, BLOCK, ID, HEIGHT, AXIS1, AXIS2, CIRC, FLOWERS, BUDS...

ℹ Use `spec()` to retrieve the full column specification for this data.
ℹ Specify the column types or set `show_col_types = FALSE` to quiet this message.
1
Warning: Removed 4 rows containing missing values or values outside the scale range
(`geom_point()`).
2
Warning: Removed 4 rows containing missing values or values outside the scale range
(`geom_point()`).