An experiment in Kenya has been exploring the influence of large herbivores on plants.
Check to see if TREE_SURVEYS.txt is in your workspace. If not, download TREE_SURVEYS.txt. Use read_tsv from the readr package to read in the data using the following command:
trees <-read_tsv("TREE_SURVEYS.txt",col_types =list(HEIGHT =col_double(),AXIS_2 =col_double()))
Update the trees data frame with a new column named canopy_area that contains the estimated canopy area calculated as the value in the AXIS_1 column times the value in the AXIS_2 column. Show output of the trees data frame with just the SURVEY, YEAR, SITE, and canopy_area columns.
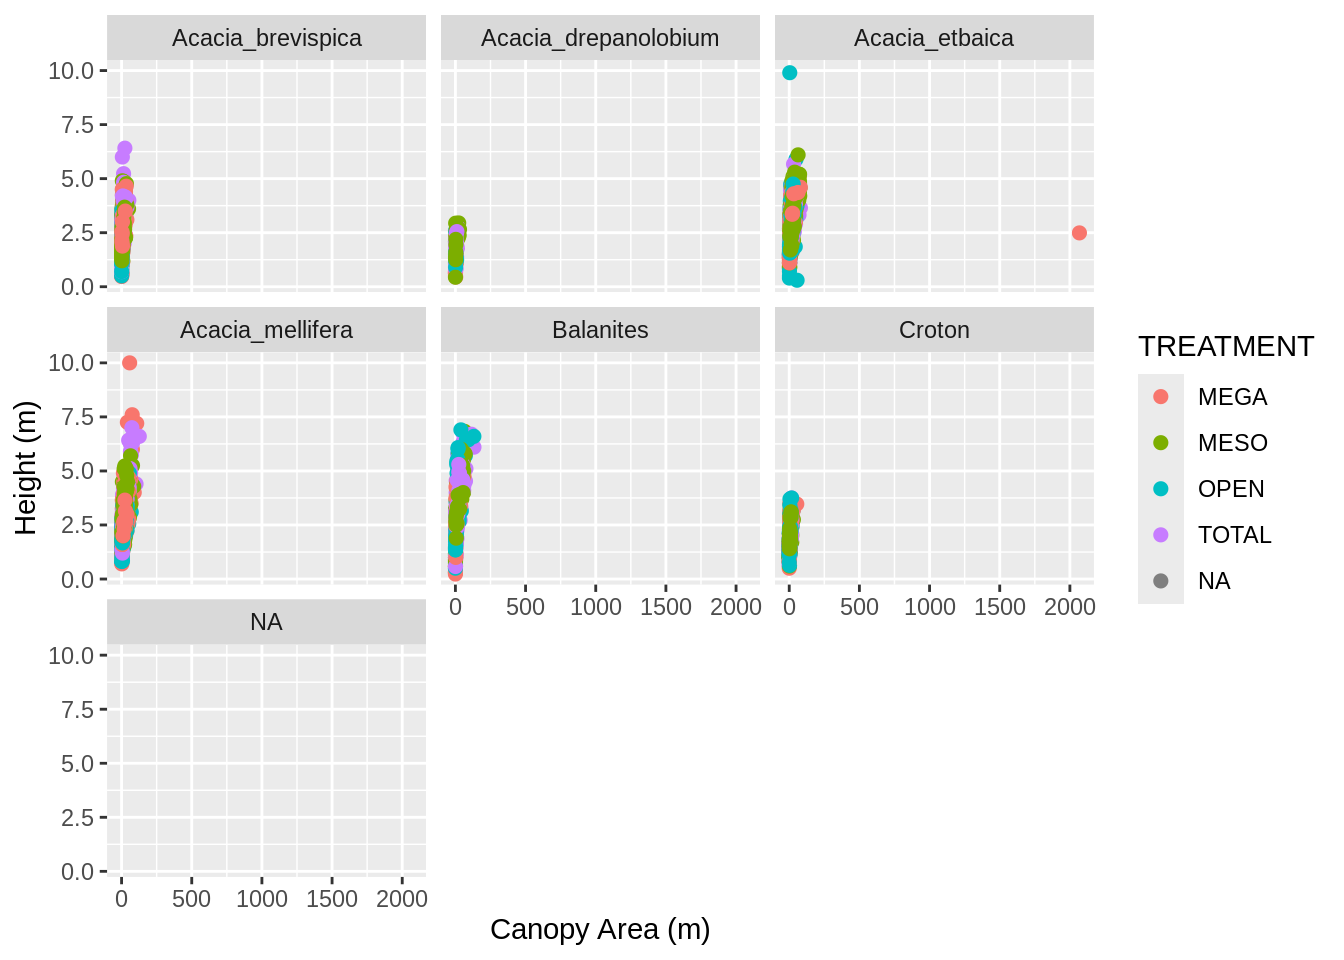
Make a scatter plot with canopy_area on the x axis and HEIGHT on the y axis. Color the points by TREATMENT and plot the points for each value in the SPECIES column in a separate subplot. Label the x axis “Canopy Area (m)” and the y axis “Height (m)”. Make the point size 2.
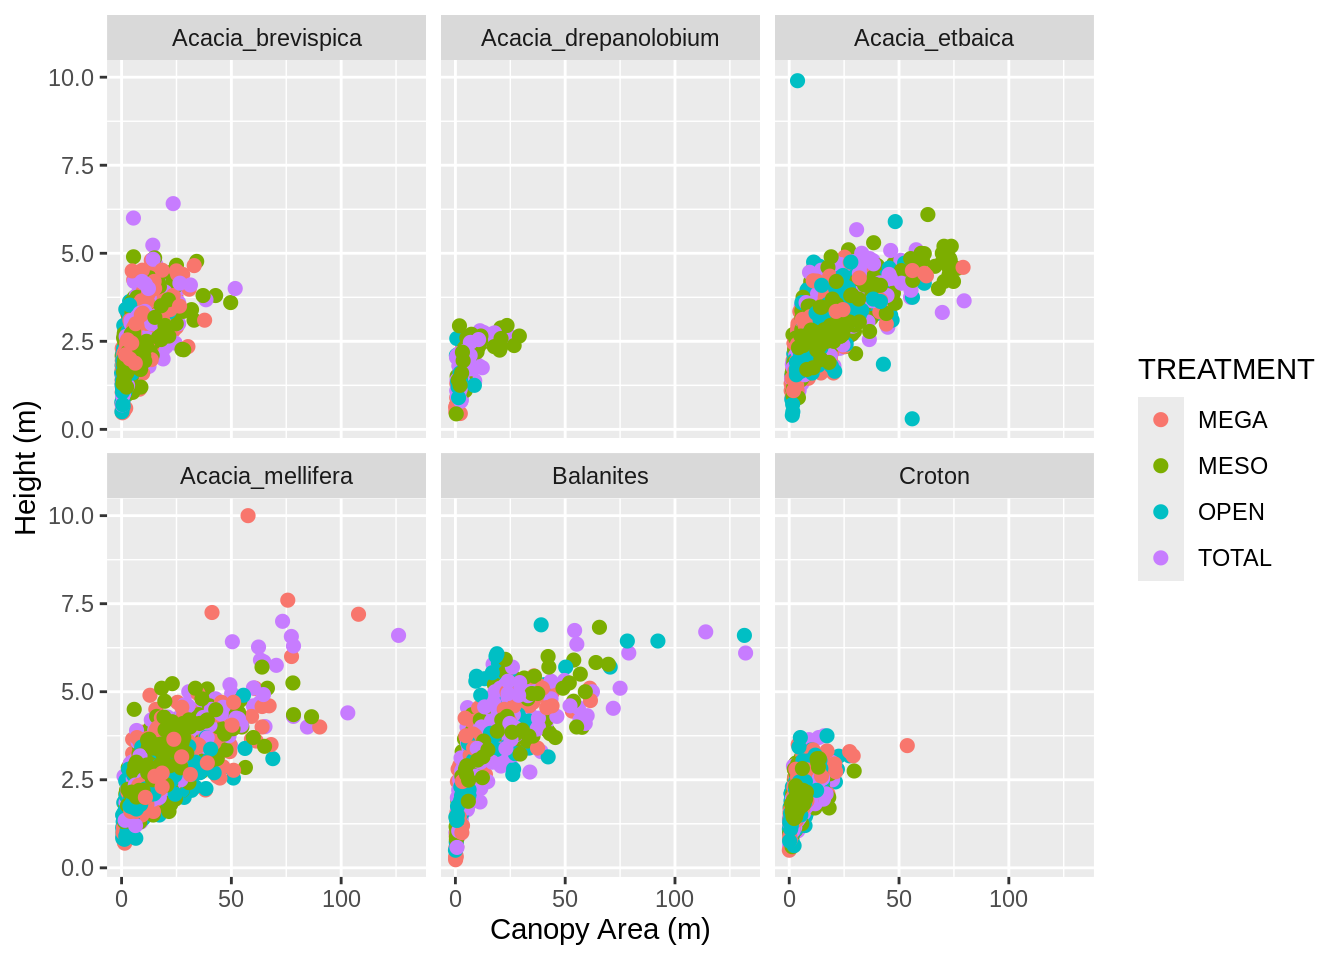
That’s a big outlier in the plot from (2). 50 by 50 meters is a little too big for a real Acacia, so filter the data to remove any values for AXIS_1 and AXIS_2 that are over 20 and update the data frame. Then remake the graph.
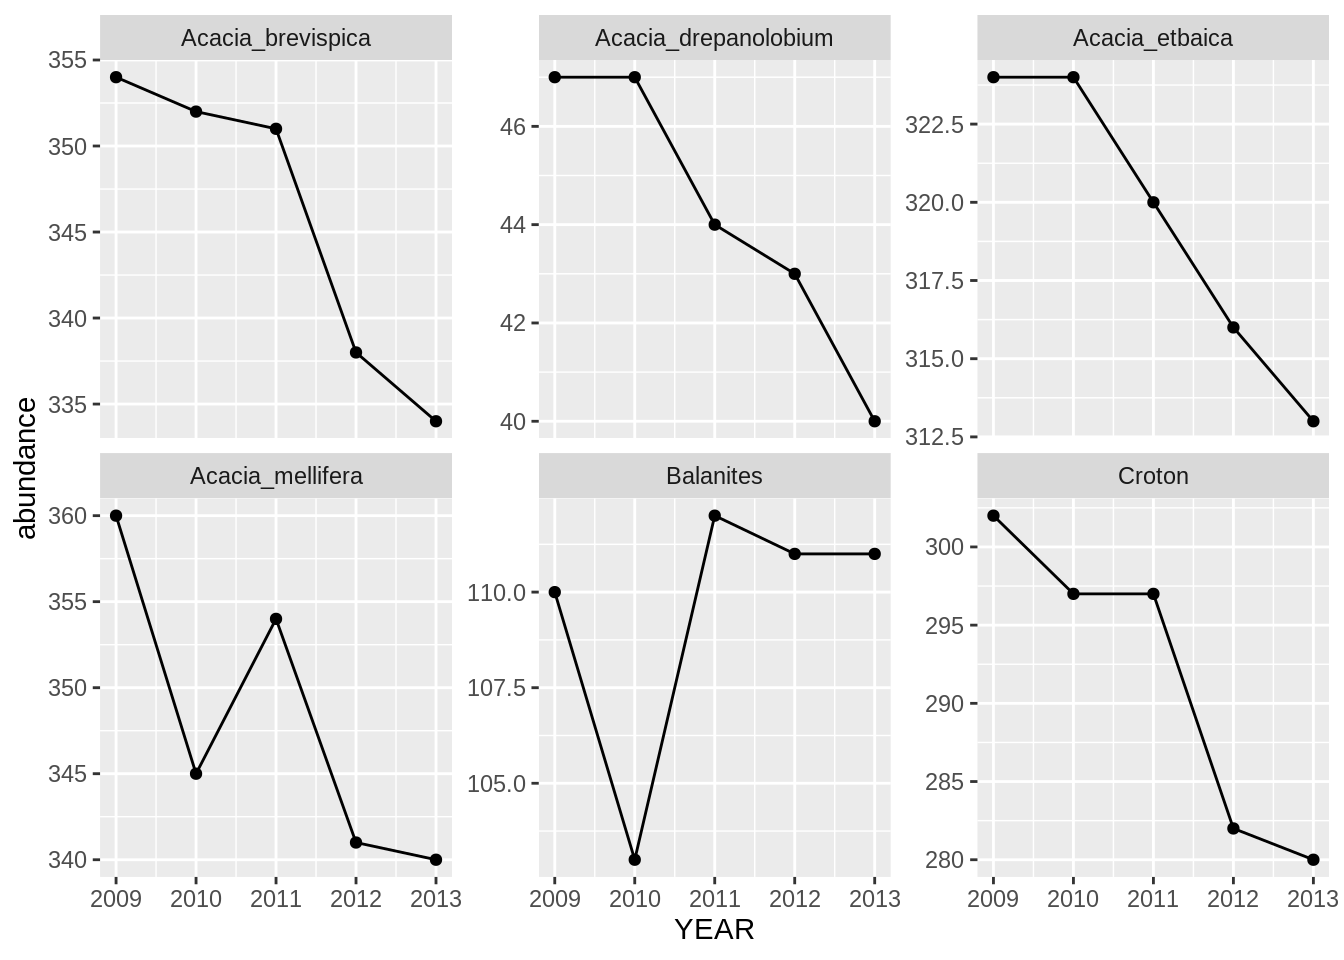
Using the data without the outlier (i.e., the data generated in (3)), find out how the abundance of each species has been changing through time. Use group_by, summarize, and n to make a data frame with YEAR, SPECIES, and an abundance column that has the number of individuals in each species in each year. Print out this data frame.
Using the data frame generated in (4), make a line plot with points (by using geom_line in addition to geom_point) with YEAR on the x axis and abundance on the y axis with one subplot per species. To let you seen each trend clearly let the scale for the y axis vary among plots by adding scales = "free_y" as an optional argument to facet_wrap.
CautionOutput solution
Code solution for Graphing Acacia and Ants Data Manipulation
Attaching package: 'dplyr'
The following objects are masked from 'package:stats':

    filter, lag
The following objects are masked from 'package:base':

    intersect, setdiff, setequal, union
Warning: One or more parsing issues, call `problems()` on your data frame for details,
e.g.:
  dat <- vroom(...)
  problems(dat)
1
# A tibble: 7,508 × 4
   SURVEY  YEAR SITE  canopy_area
    <dbl> <dbl> <chr>       <dbl>
 1      1  2009 SOUTH       30.5
 2      2  2010 SOUTH       69.7
 3      3  2011 SOUTH       79.6
 4      4  2012 SOUTH       39.0
 5      5  2013 SOUTH       40.8
 6      1  2009 SOUTH        6.16
 7      2  2010 SOUTH        7.29
 8      3  2011 SOUTH       12.5
 9      4  2012 SOUTH       NA
10      5  2013 SOUTH        9.62
# ℹ 7,498 more rows
2
Warning: Removed 215 rows containing missing values or values outside the scale range
(`geom_point()`).
3
4
`summarise()` has grouped output by 'YEAR'. You can override using the
`.groups` argument.