An experiment in Kenya has been exploring the influence of large herbivores on plants.
Check to see if ACACIA_DREPANOLOBIUM_SURVEY.txt is in your workspace. If not, download it. Read it into R using the following command:
acacia <-read_tsv("data/ACACIA_DREPANOLOBIUM_SURVEY.txt", na =c("dead"))
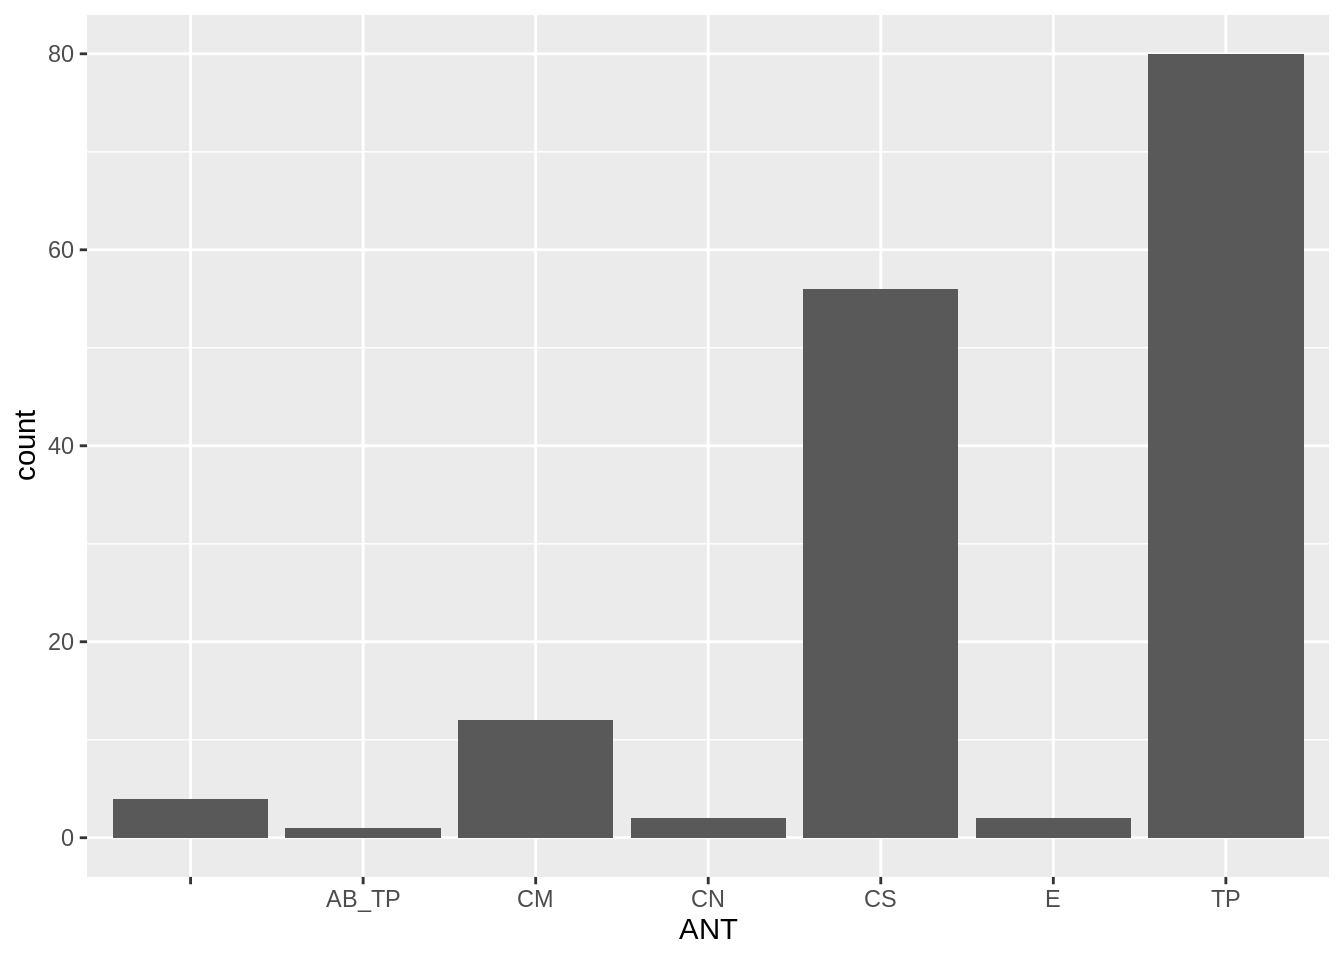
Make a bar plot of the number of acacia with each mutualist ant species (using the ANT column).
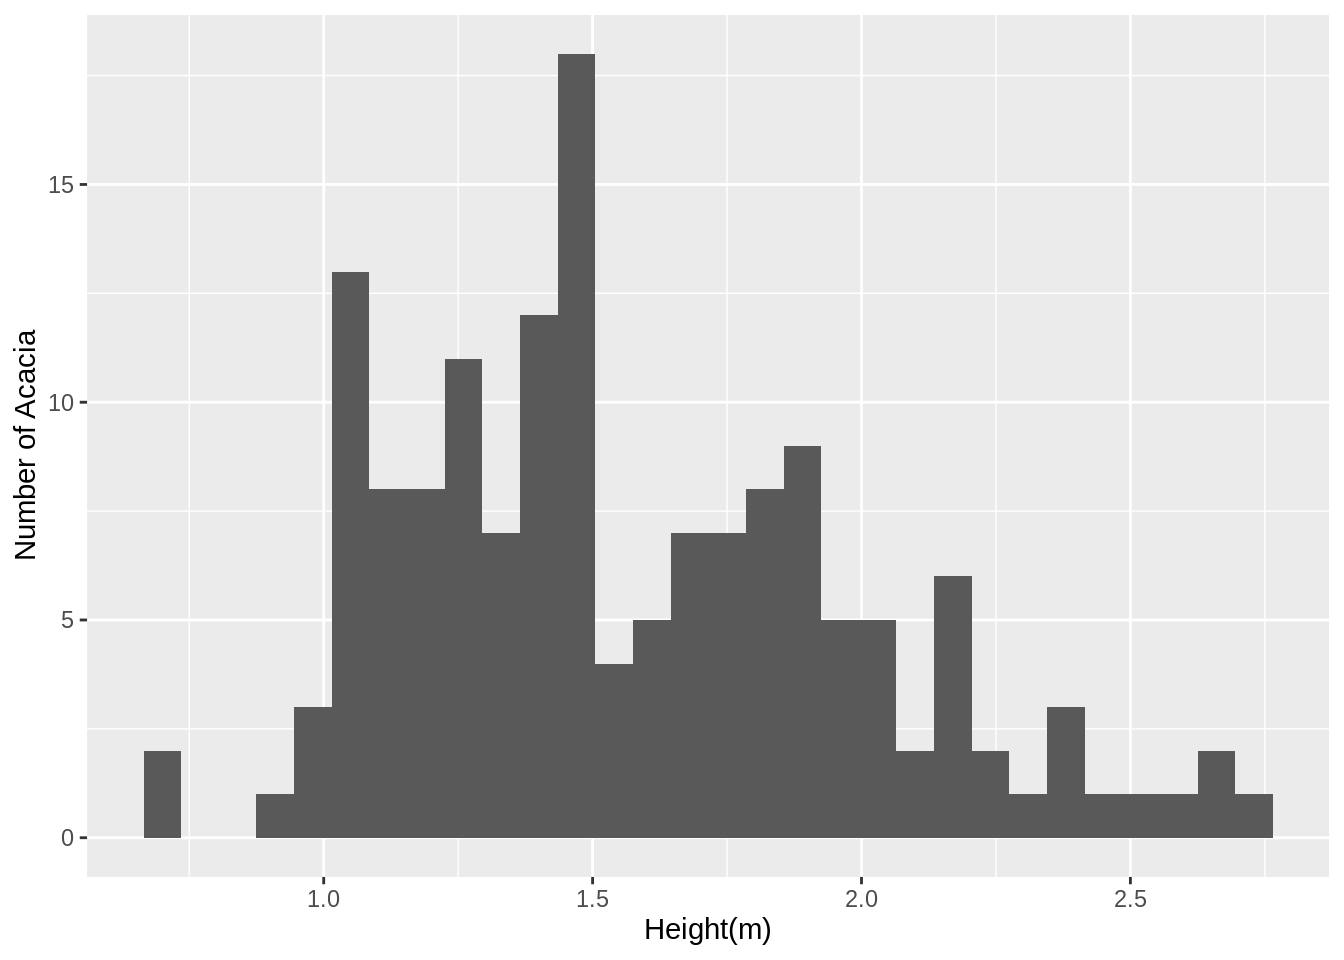
Make a histogram of the height of acacia (using the HEIGHT column). Label the x axis “Height (m)” and the y axis “Number of Acacia”.
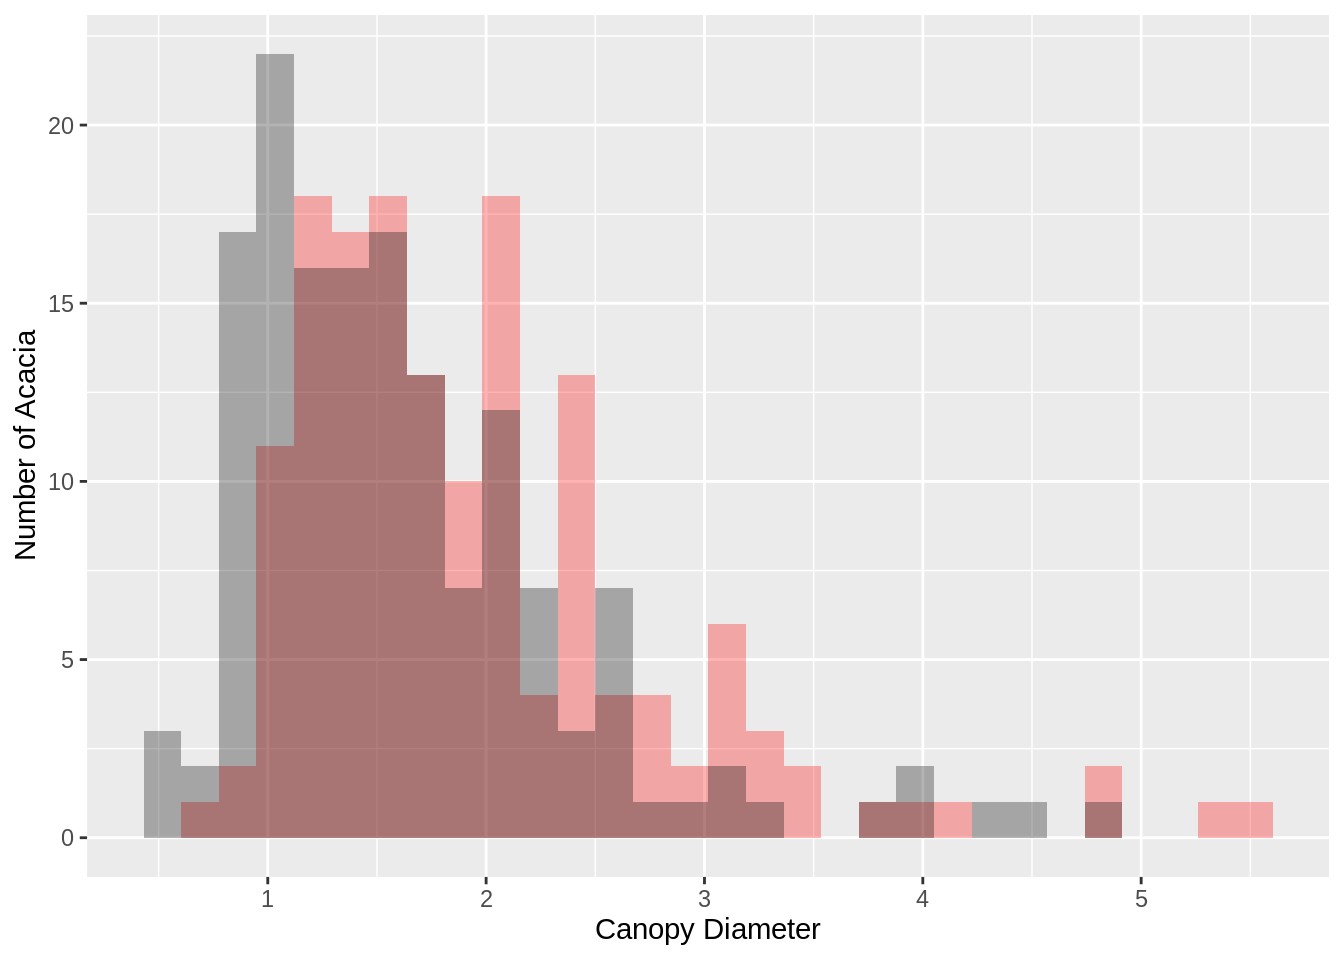
Make a non-stacked histogram of the height of acacia (using the HEIGHT column) colored by the TREATMENT. Set the transparency (using alpha) to 0.5 so that you can see all of the bars. Label the x-axis “Heigth (m)” and the y-axis “Count of Acacia”. Set the binwidth to 0.5.
CautionOutput solution
Code solution for Graphing Acacia and Ants Histograms
Warning: One or more parsing issues, call `problems()` on your data frame for details,
e.g.:
  dat <- vroom(...)
  problems(dat)
Rows: 157 Columns: 15
── Column specification ────────────────────────────────────────────────────────
Delimiter: "\t"
chr  (4): SITE, TREATMENT, PLOT, ANT
dbl (11): SURVEY, YEAR, BLOCK, ID, HEIGHT, AXIS1, AXIS2, CIRC, FLOWERS, BUDS...

ℹ Use `spec()` to retrieve the full column specification for this data.
ℹ Specify the column types or set `show_col_types = FALSE` to quiet this message.
1
2
`stat_bin()` using `bins = 30`. Pick better value `binwidth`.
Warning: Removed 4 rows containing non-finite outside the scale range
(`stat_bin()`).
3
Warning: Removed 4 rows containing non-finite outside the scale range
(`stat_bin()`).