An experiment in Kenya has been exploring the influence of large herbivores on plants.
Check to see if ACACIA_DREPANOLOBIUM_SURVEY.txt is in your workspace. If not, download it. Read it into R using the following command:
acacia <-read_tsv("ACACIA_DREPANOLOBIUM_SURVEY.txt", na =c("dead"))
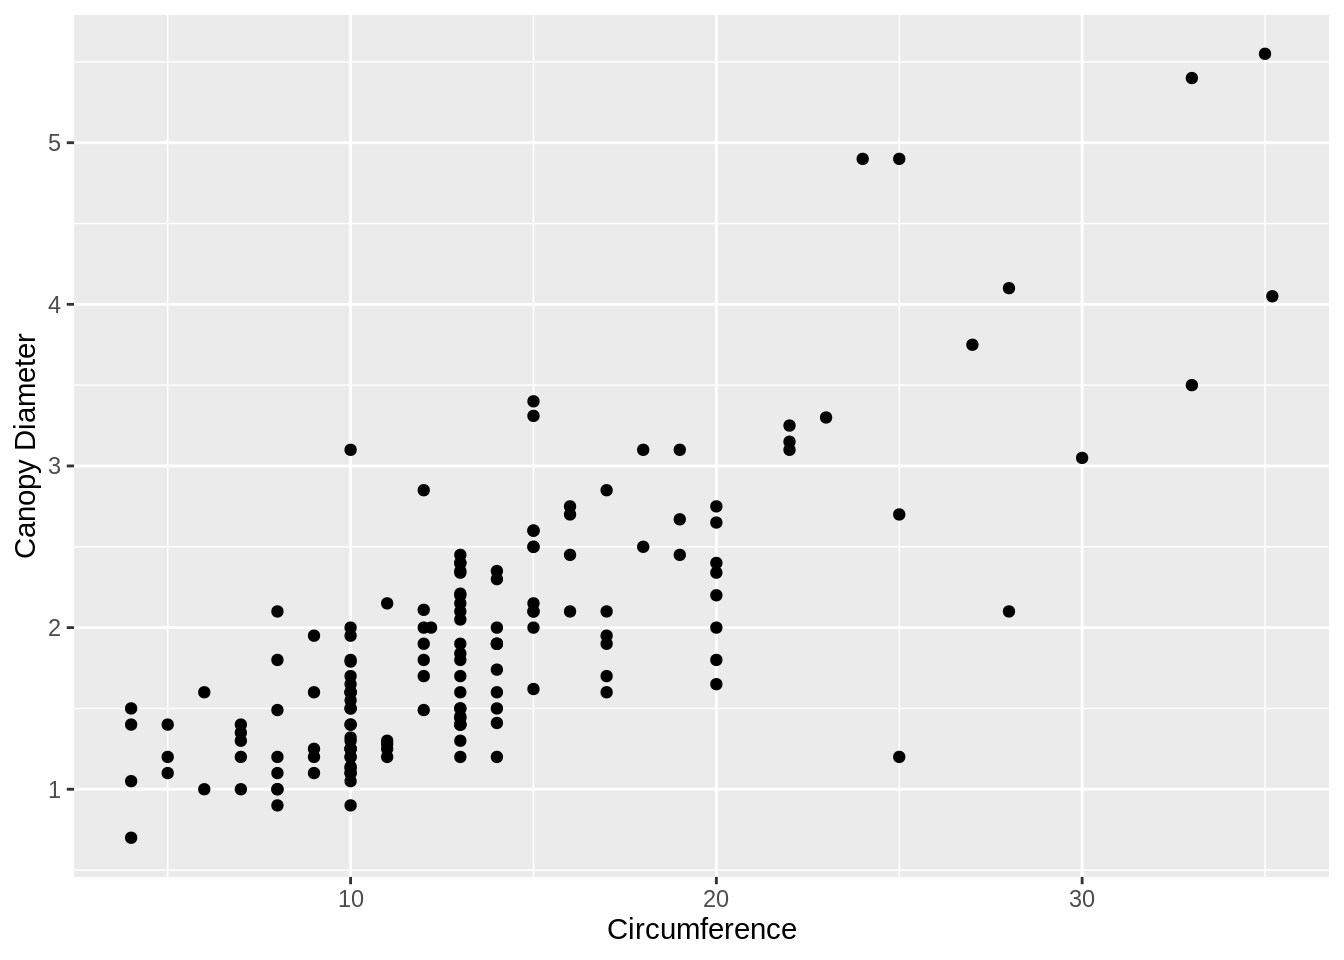
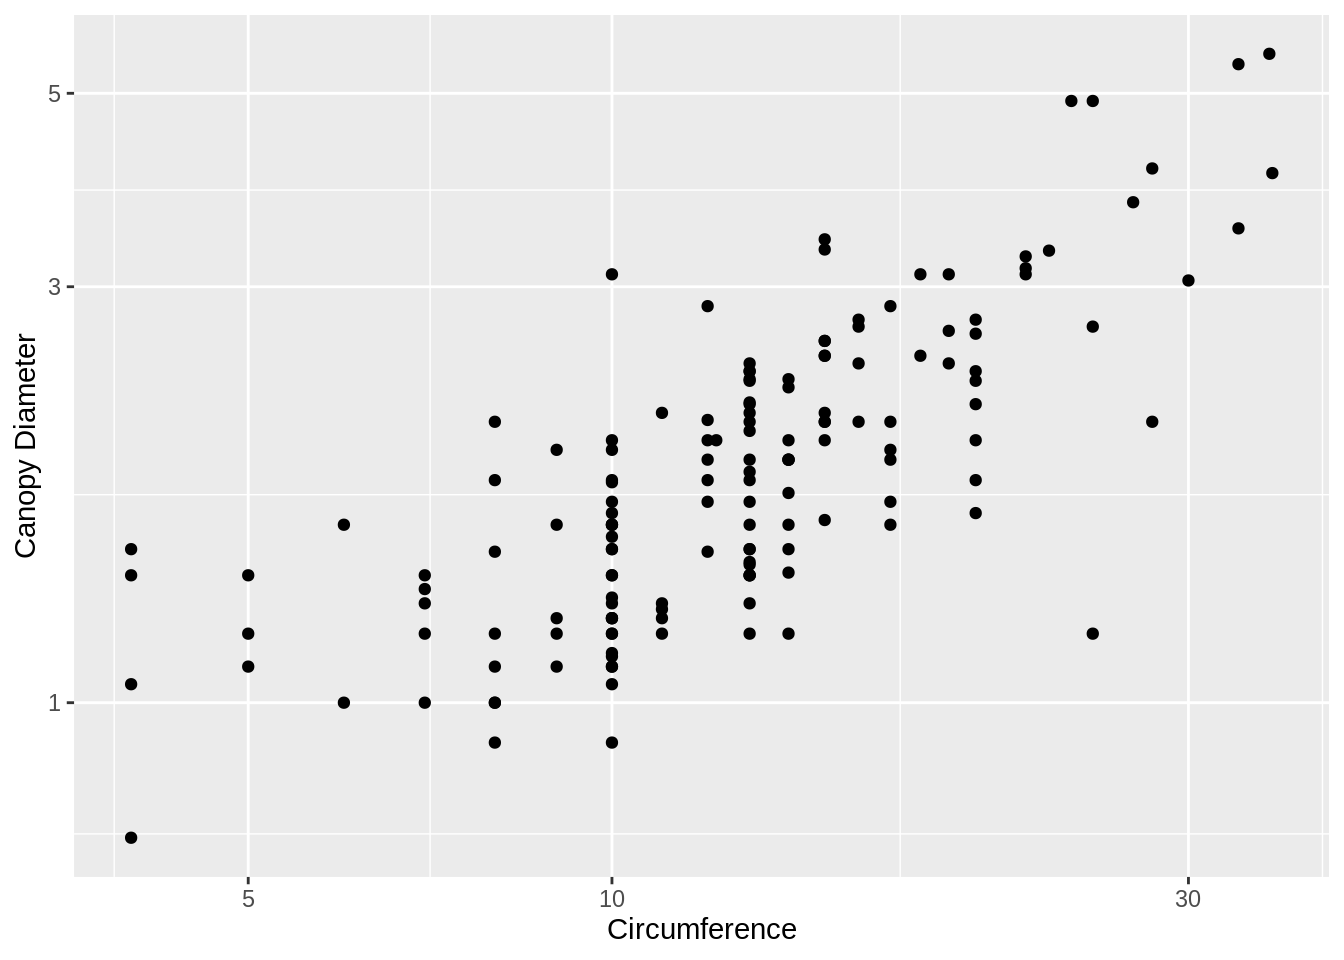
Make a scatter plot with CIRC on the x axis and AXIS1 (the maximum canopy width) on the y axis. Label the x axis “Circumference” and the y axis “Canopy Diameter”.
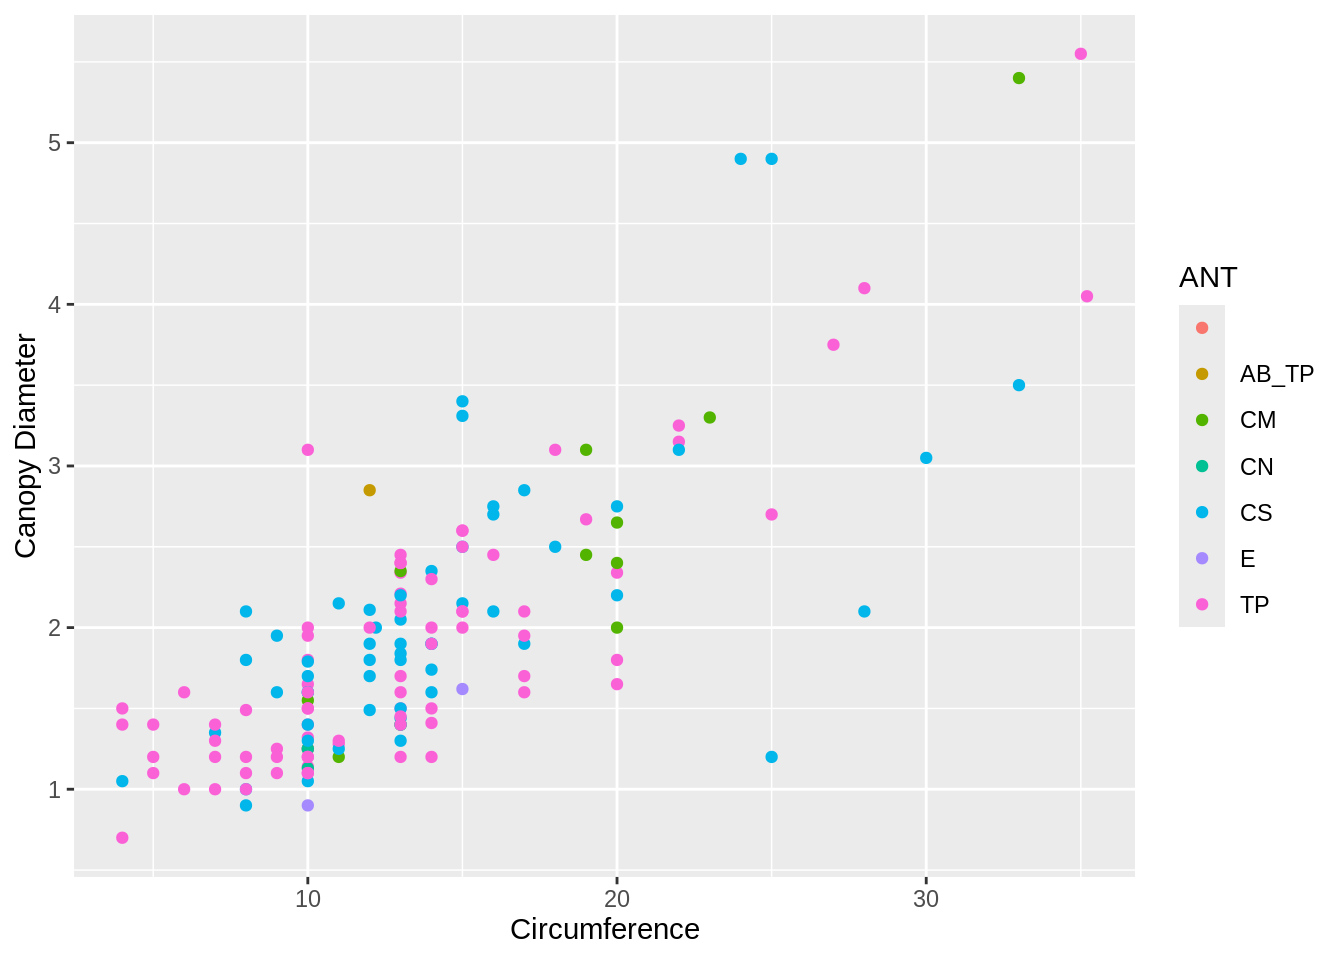
The same plot as (1), but with points colored based on the ANT column (the species of ant symbiont living with the acacia)
The same plot as (2), but instead of different colors show different species of ant (values of ANT) each in a separate subplot.
CautionOutput solution
Code solution for Graphing Acacia and Ants
Warning: One or more parsing issues, call `problems()` on your data frame for details,
e.g.:
  dat <- vroom(...)
  problems(dat)
Rows: 157 Columns: 15
── Column specification ────────────────────────────────────────────────────────
Delimiter: "\t"
chr  (4): SITE, TREATMENT, PLOT, ANT
dbl (11): SURVEY, YEAR, BLOCK, ID, HEIGHT, AXIS1, AXIS2, CIRC, FLOWERS, BUDS...

ℹ Use `spec()` to retrieve the full column specification for this data.
ℹ Specify the column types or set `show_col_types = FALSE` to quiet this message.
1
Warning: Removed 4 rows containing missing values or values outside the scale range
(`geom_point()`).
2
Warning: Removed 4 rows containing missing values or values outside the scale range
(`geom_point()`).
3
Warning: Removed 4 rows containing missing values or values outside the scale range
(`geom_point()`).