acacia <-read_tsv("data/ACACIA_DREPANOLOBIUM_SURVEY.txt", na =c("dead"))
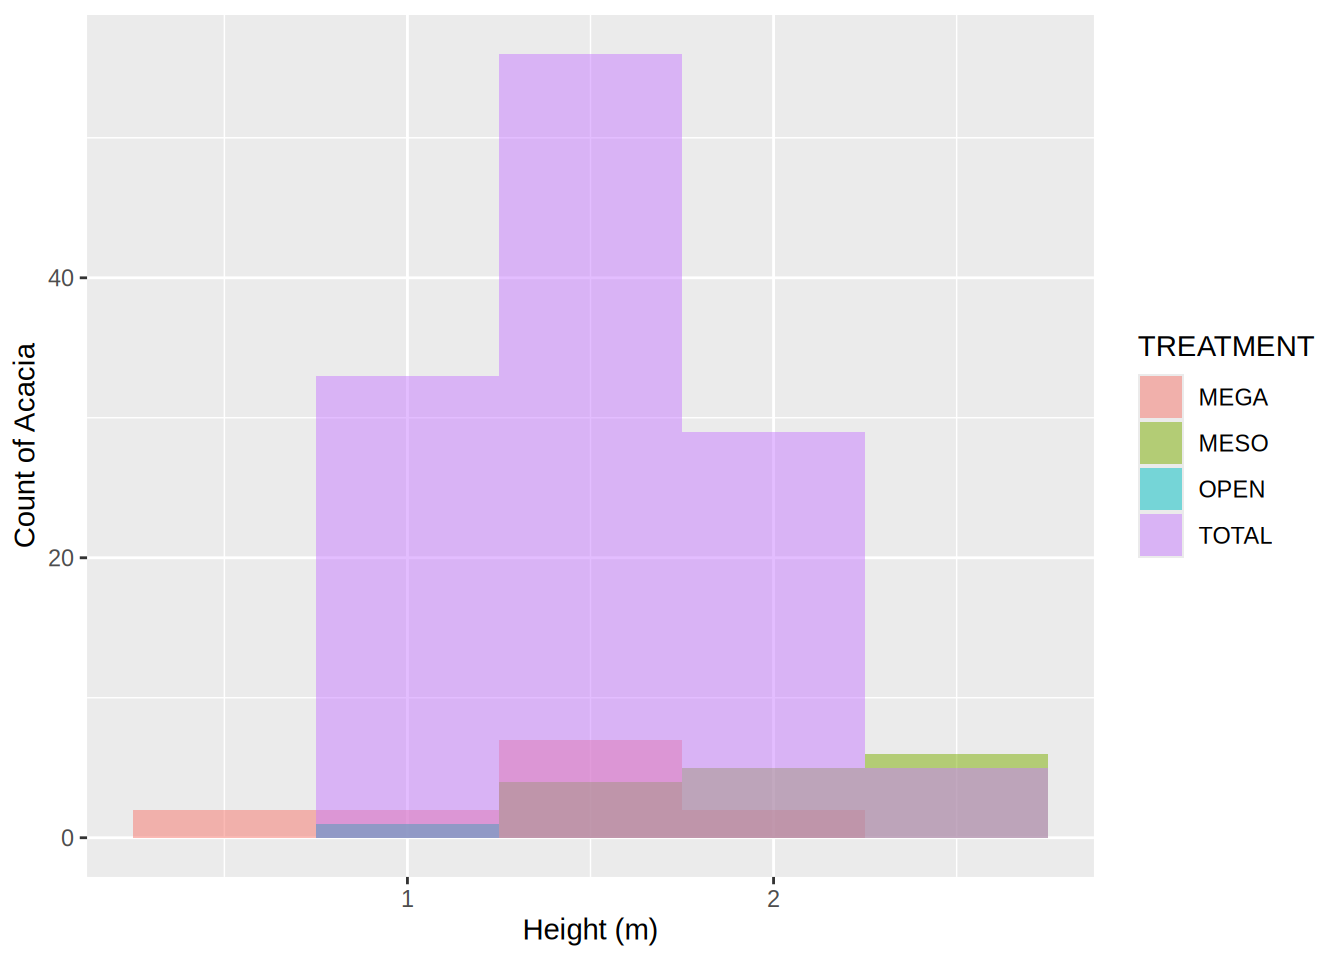
Make a non-stacked histogram of the height of acacia (using the HEIGHT column) colored by the TREATMENT. Set the transparency (using alpha) to 0.5 so that you can see all of the bars. Label the x-axis “Height (m)” and the y-axis “Count of Acacia”. Set the binwidth to 0.5.
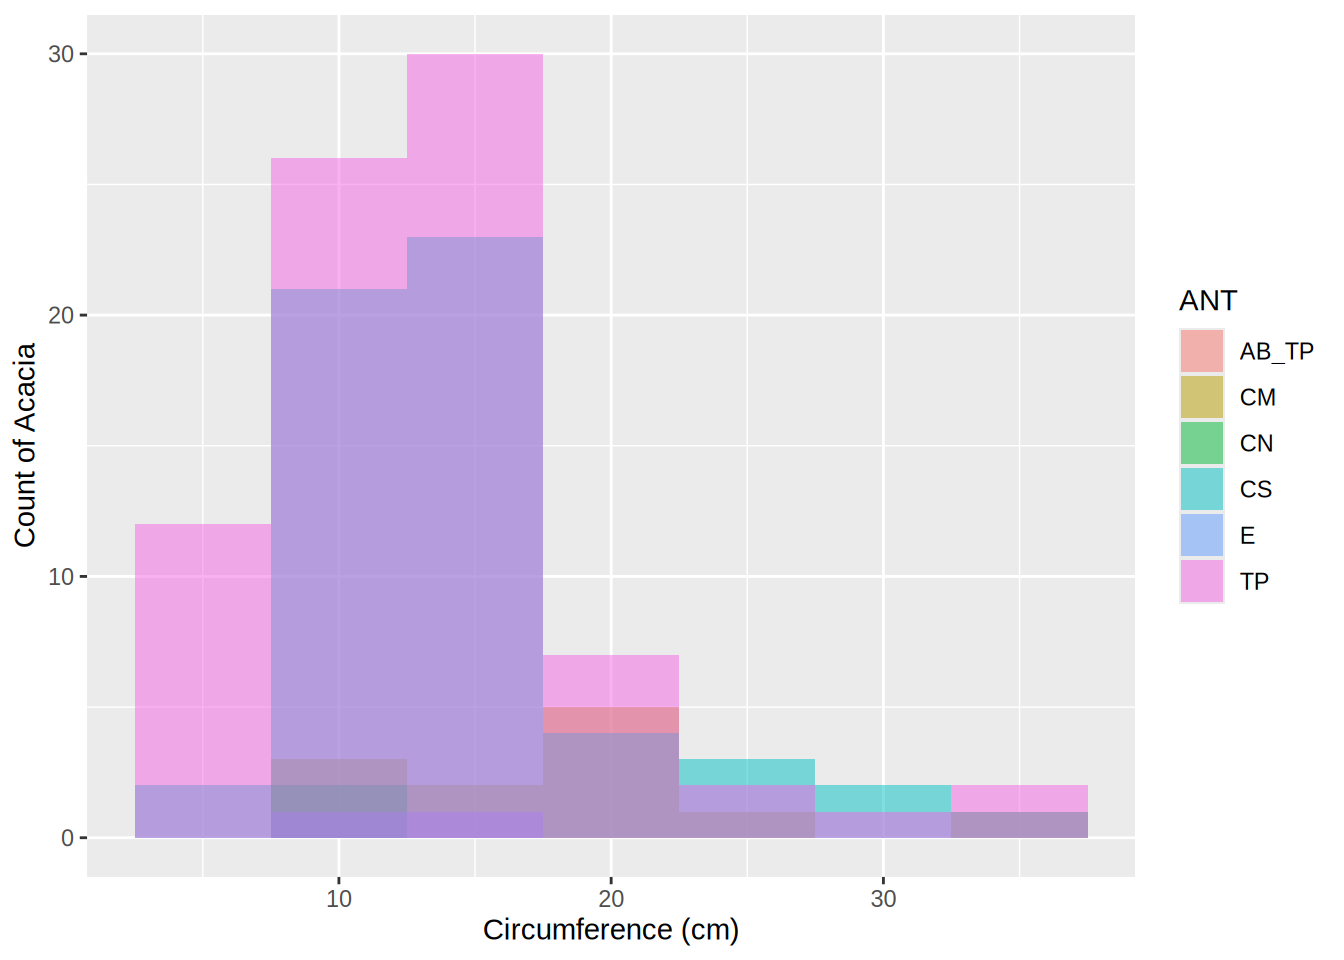
Make a non-stacked histogram of the circumference of acacia (using the CIRC column) colored by the ANT column. Set the transparency (using alpha) to 0.5 so that you can see all of the bars. Label the x-axis “Circumference (cm)” and the y-axis “Count of Acacia”. Set the binwidth to 5.
CautionOutput solution
Code solution for Graphing Acacia and Ants Stacked Plots
Warning: One or more parsing issues, call `problems()` on your data frame for details,
e.g.:
  dat <- vroom(...)
  problems(dat)
Rows: 157 Columns: 15
── Column specification ────────────────────────────────────────────────────────
Delimiter: "\t"
chr  (4): SITE, TREATMENT, PLOT, ANT
dbl (11): SURVEY, YEAR, BLOCK, ID, HEIGHT, AXIS1, AXIS2, CIRC, FLOWERS, BUDS...

ℹ Use `spec()` to retrieve the full column specification for this data.
ℹ Specify the column types or set `show_col_types = FALSE` to quiet this message.
1
Warning: Removed 4 rows containing non-finite outside the scale range
(`stat_bin()`).
2
Warning: Removed 4 rows containing non-finite outside the scale range
(`stat_bin()`).