Scientific tree biomass challenge (solution)

Exercise

Understanding the total amount of biomass (the total mass of all individuals) in forests is important for understanding the global carbon budget and how the earth will respond to increases in carbon dioxide emissions.

We don’t normally measure the mass of a tree, but take a measurement of the diameter of the trunk and then estimate mass using equations like mass = 0.124 * diameter2.53.

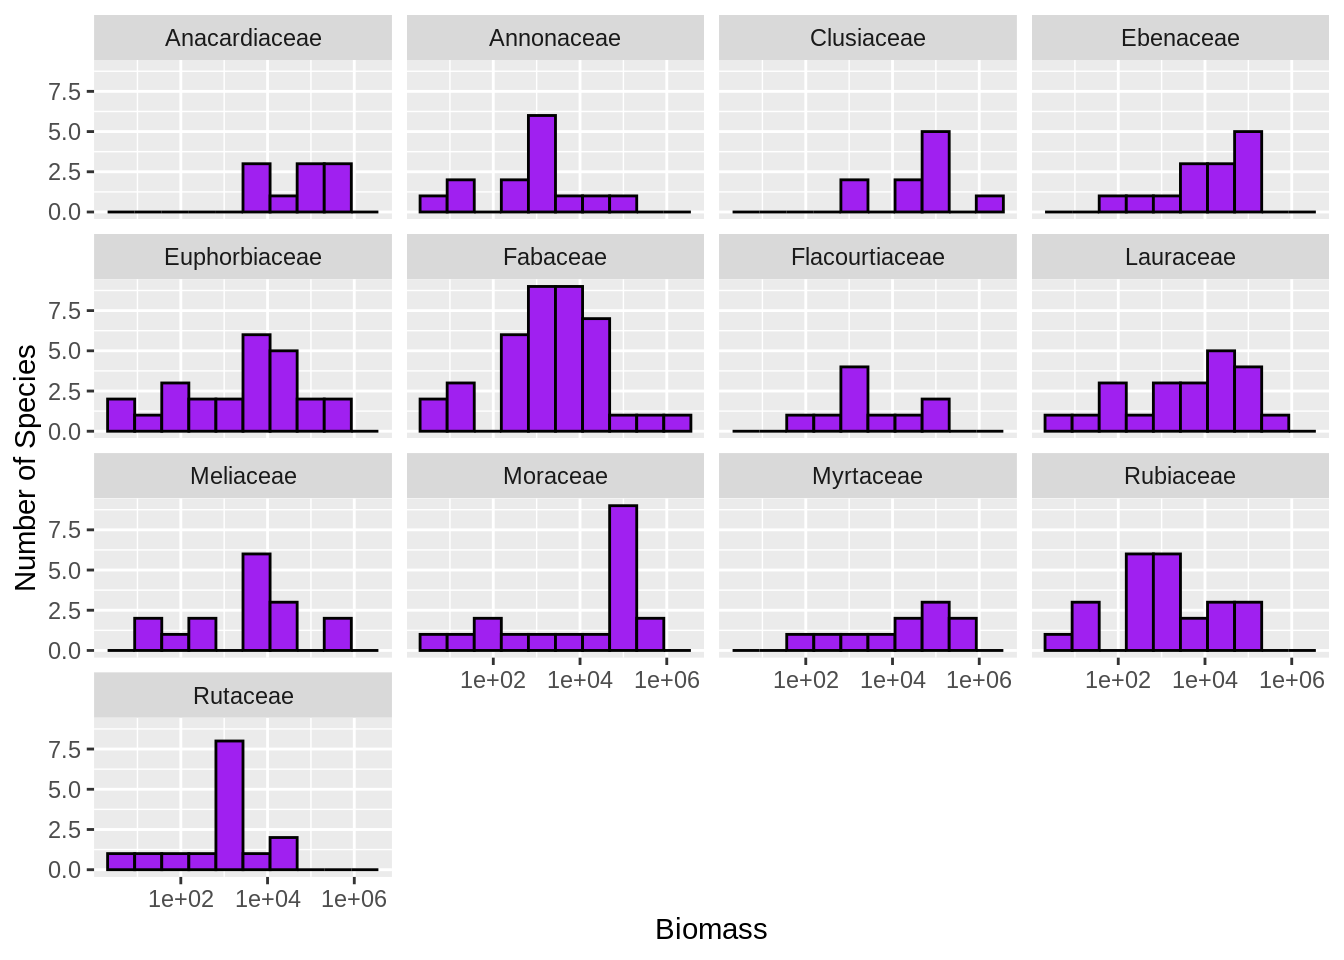
Make a histogram of the estimated tree biomass (using the above equation) for each species in a 96 hectare area of the Western Ghats in India using the data in ramesh2010-macroplots.csv and ramesh2010-species-list.tsv (if they aren’t already in your workspace then download them). Make one subplot for each family, only include families with at least 10 species (because otherwise there isn’t enough information for the histogram), scale the x axis logarithmically, color the bars purple and outline them in black, and provide good descriptive axis labels.

Output solution

Attaching package: 'dplyr'
The following objects are masked from 'package:stats':

    filter, lag
The following objects are masked from 'package:base':

    intersect, setdiff, setequal, union
Rows: 65889 Columns: 4
── Column specification ────────────────────────────────────────────────────────
Delimiter: ","
chr (2): PlotID, SpCode
dbl (2): record_id, diameter

ℹ Use `spec()` to retrieve the full column specification for this data.
ℹ Specify the column types or set `show_col_types = FALSE` to quiet this message.
Rows: 446 Columns: 8
── Column specification ────────────────────────────────────────────────────────
Delimiter: "\t"
chr (7): SpCode, Name, Author, Synonym, Family, Habit, Pheno
dbl (1): WGEnd

ℹ Use `spec()` to retrieve the full column specification for this data.
ℹ Specify the column types or set `show_col_types = FALSE` to quiet this message.
`summarise()` has grouped output by 'Family'. You can override using the `.groups` argument.